• About
  • Take Action
  • Resources / Recursos
  • Narratives
  • Reports & Writing
  • Donate
Anti-Eviction Mapping Project
  • About
  • Take Action
  • Resources / Recursos
  • Narratives
  • Reports & Writing
  • Donate

The Social Geography of Eviction in LA

LA Evictions by Zip Code (2018-2025)
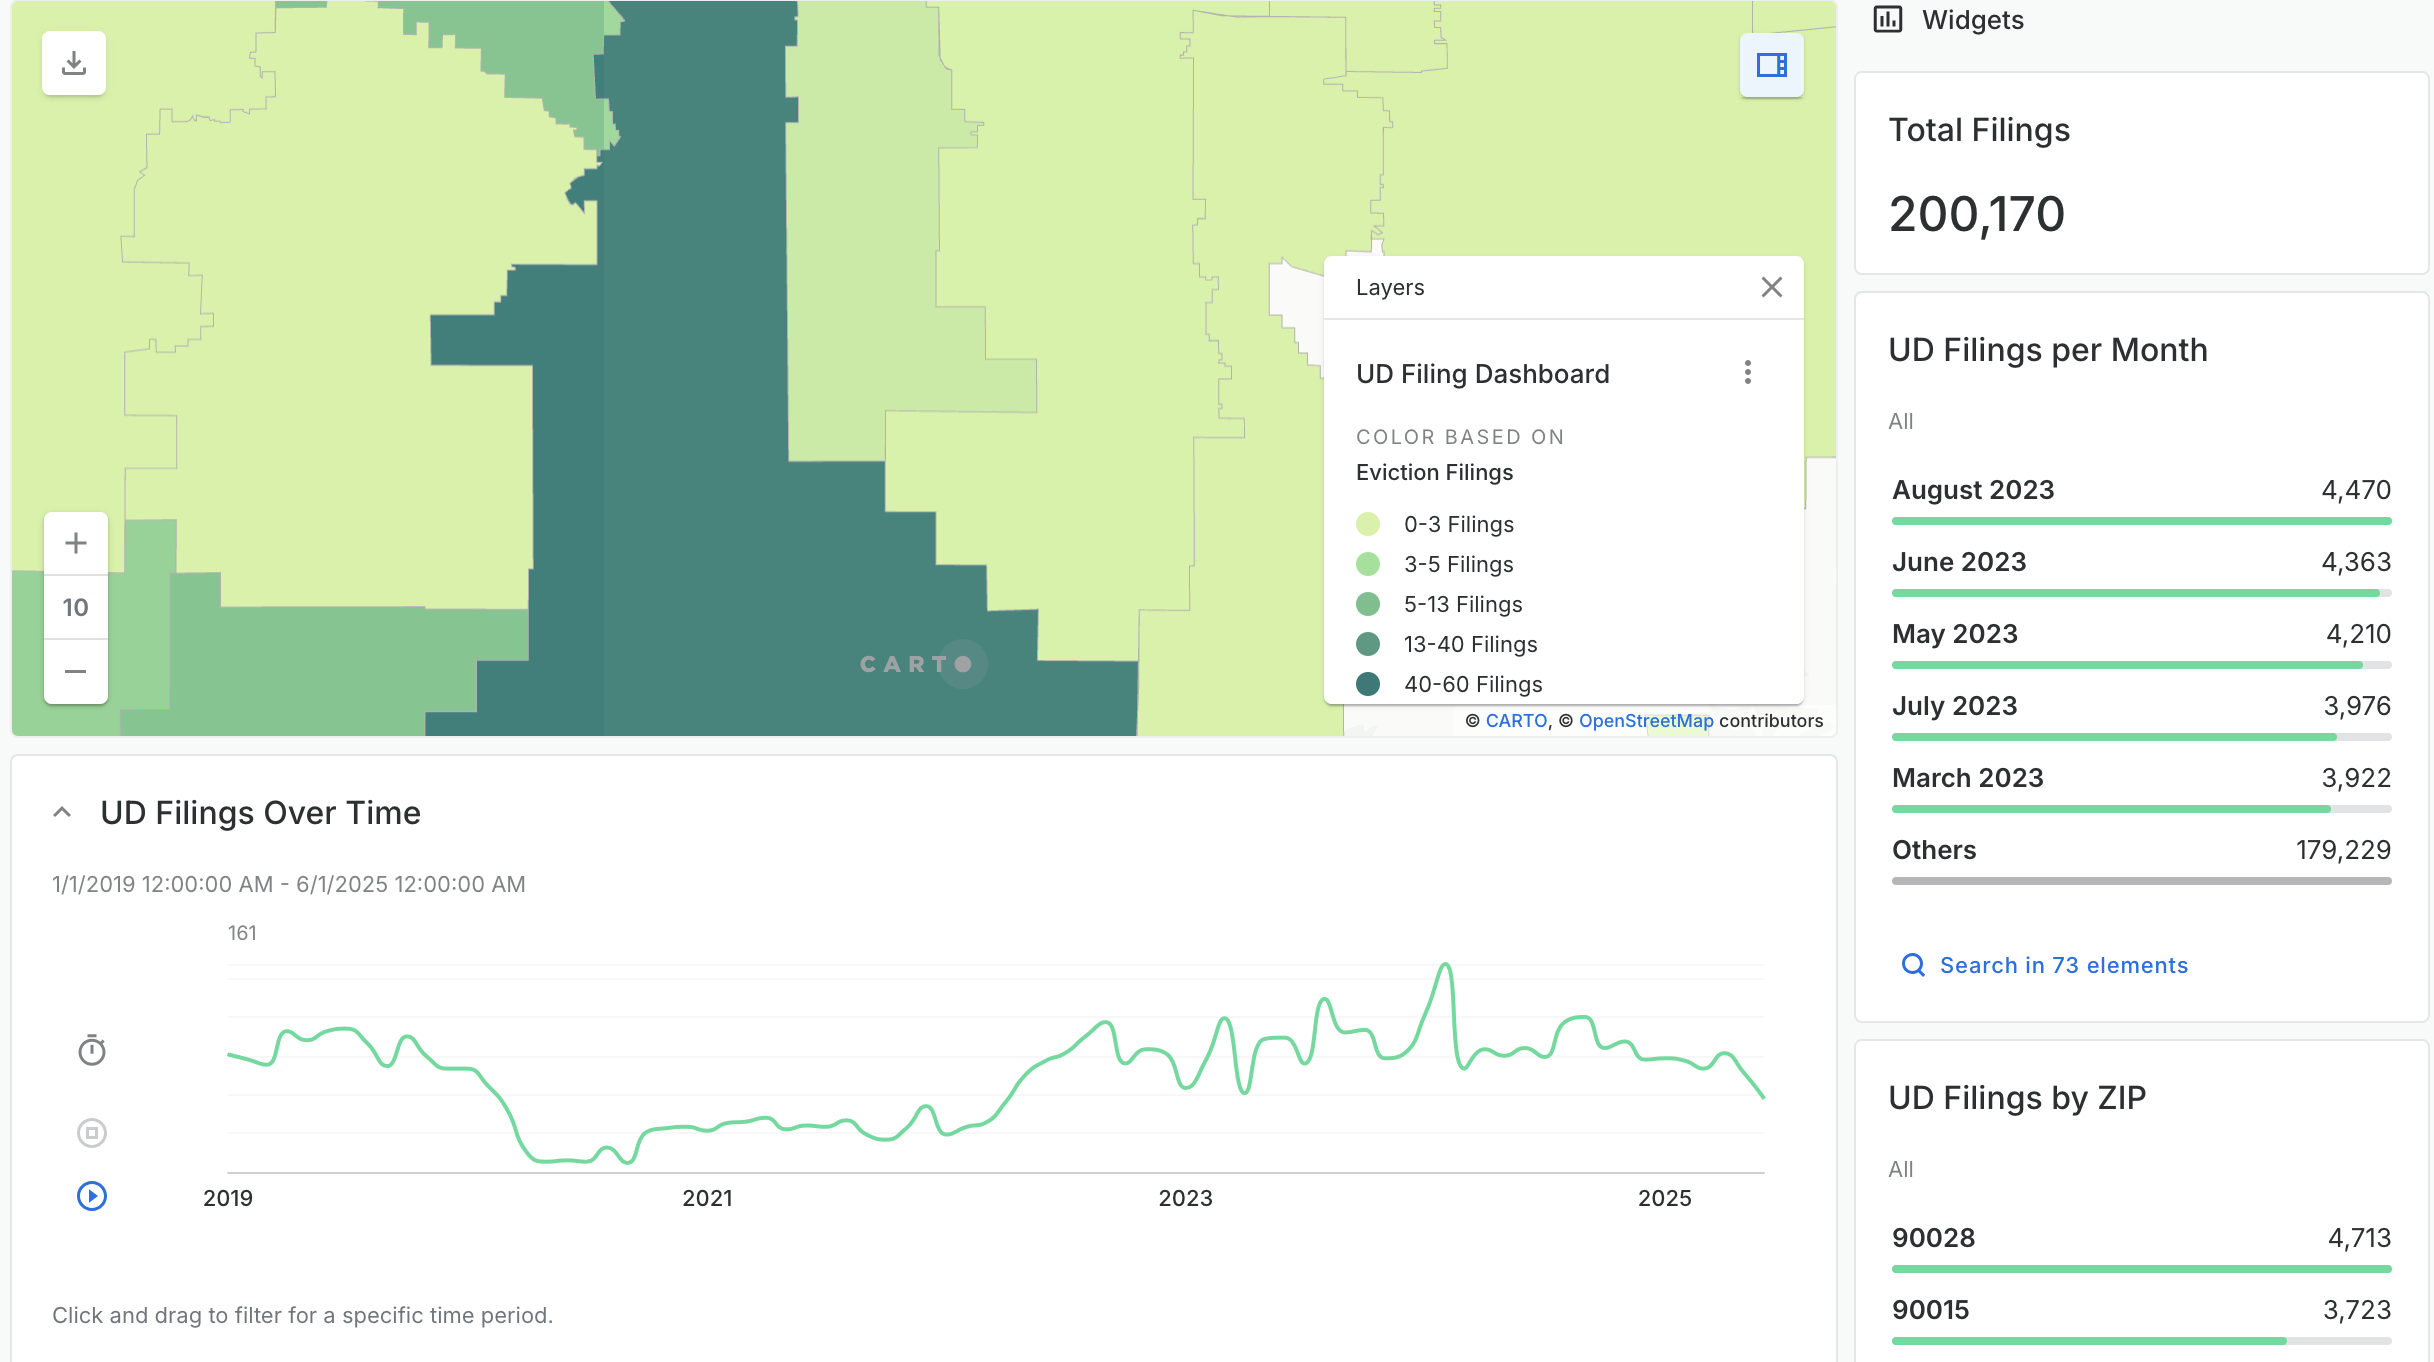
LA Evictions by Zipcode map

Click to enter the map

How to use the map:

  1. Filter for specific months: Under “UD Filings per Month,” search for a year and then select the months you want. For example, type in “2023” and then select “January 2023” and “February 2023”.

  2. Filter for a longer time period: Drag your cursor across the timeline below the map to select a time period. 

  3. Filter for a ZIP code: Under “UD Filings by ZIP”, search for your ZIP code. For example, type “90028”. Check the box next to the ZIP code to select multiple. 

You can filter for both a time period and ZIP codes at the same time. The “Total Filings” value will update based on your filters.

Since its inception, the Anti-Eviction Mapping Project has dedicated itself to visualizing eviction, displacement, and other issues that tenants face in the cities where we have chapters. 

Understanding where eviction happens is vital to both organizers and policymakers so that we can collectively work to prevent evictions from happening by targeting our efforts on the neighborhoods where evictions are concentrated. 

This is especially important in Los Angeles County, a region that is home to approximately 5 million renters in an area larger than Delaware and Rhode Island. As this map shows, however, evictions are not randomly distributed across the county - they’re concentrated in neighborhoods in Downtown LA, Southeast Los Angeles, and the Antelope Valley. 

Our map, “The Social Geography of Eviction in LA” draws on administrative data on eviction filings that has been painstakingly collected by AEMP’s LA chapter since 2018. Our map can be used to look at eviction filings across different periods of time and through an animated time series feature. We are also making the data publicly available (see this link). We hope to update both the map and the dataset quarterly.

We hope that activists and policymakers can use this map and the data to help end the County’s dual affordable housing and homelessness crises towards the goal of housing justice for all. 

Donate